
In today’s dynamic technological landscape, tracing agents and libraries stand as indispensable tools for achieving comprehensive distributed tracing. Tracing agents employ an outside-in approach,...
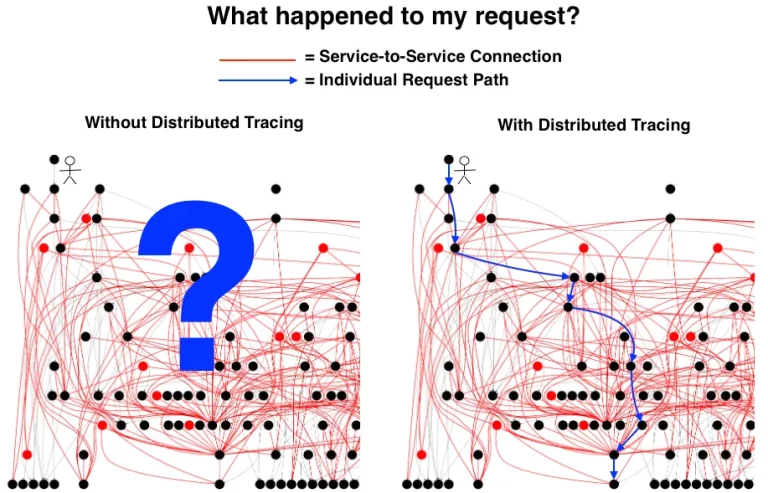
In today’s fast-paced digital landscape, the cost of performance degradation or downtime in applications can amount to millions of dollars for businesses. Integrating effective diagnostic capabilities...
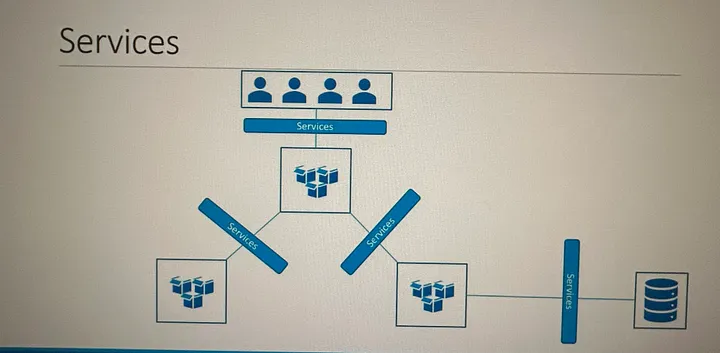
Kubernetes Services enable communication between various components within and outside of the application. Kubernetes Services helps us connect applications together with other applications or users. Kubernetes...
The various elements that interact with one another in order to produce, manage, store, organize, analyze and share data To put it simply, an ecosystem is a group of elements that interact with one another....