Let’s go through the K-Means algorithm using a very simple example. Let’s consider a set of 10 points on a plane and try to group these points into, say, 2 clusters. So let’s see how the K-Means algorithm achieves this goal.
[Note: If you don’t know what is meant by Euclidean distance, you’re advised to go through this link]
Before moving ahead, think about the following problem. Let’s say you have the data of 10 students and their marks in Biology and Math (as shown in the plot below). You want to divide them into two clusters so that you can see what kind of students are there in the class.
The y-axis shows the marks in Biology, and the x-axis shows the marks in Math.
Imagine two clusters dividing this data — one red and the other yellow. How many points would each cluster have?

Centroid
The K-Means algorithm uses the concept of the centroid to create K clusters. Before you move ahead, it will be useful to recall the concept of the centroid.
In simple terms, a centroid of n points on an x-y plane is another point having its own x and y coordinates and is often referred to as the geometric centre of the n points.
For example, consider three points having coordinates (x1, y1), (x2, y2) and (x3, y3). The centroid of these three points is the average of the x and y coordinates of the three points, i.e.
(x1 + x2 + x3 / 3, y1 + y2 + y3 / 3).
Similarly, if you have n points, the formula (coordinates) of the centroid will be:
(x1+x2…..+xn / n, y1+y2…..+yn / n).
So let’s see how the K-Means algorithm achieves this goal.
Each time the clusters are made, the centroid is updated. The updated centroid is the centre of all the points which fall in the cluster associated with the centroid. This process continues till the centroid no longer changes, i.e. the solution converges.
Thus, you can see that the K-means algorithm is a clustering algorithm that takes N data points and groups them into K clusters. In this example, we had N =10 points and we used the K-means algorithm to group these 10 points into K = 2 clusters.

Download the Excel file below. It is designed to give you the hands-on practice of the k-means clustering algorithm. The file contains a set of 10 points (with x and y coordinates in column A and B respectively) and two initial centres 1 and 2 (in columns F and G). Answer the questions below based on the Excel file.
K Means Algorithm
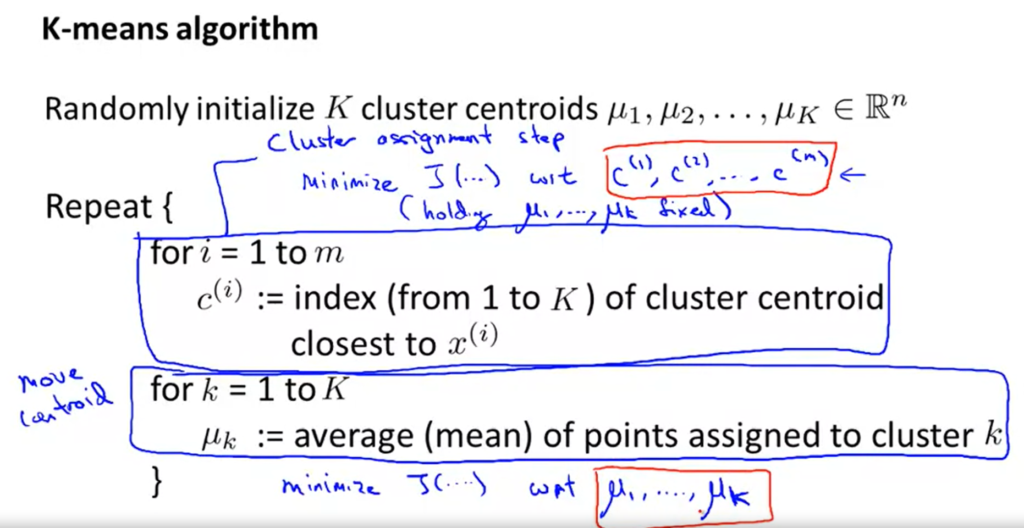
In the previous segment, we learned about K-means clustering and how the algorithm works using a simple example. We learned about how assignment and optimization work in K Means clustering, Now in this lecture, we will look at K-means more algorithmically. We will be learning how the K Means algorithm proceeds with the assignment step and then with the optimization step and will also be looking at the cost of function for the K-means algorithm.
Let’s understand the K-means algorithm in more detail.
From the previous lecture, we understood that the algorithm’s inner-loop iterates over two steps:
- Assign each observation Xi to the closest cluster centroid μk
- Update each centroid to the mean of the points assigned to it.
In the next lecture, we will learn about the Kmeans cost function and will also see how to compute the cost function for each iteration in the K-means algorithm.
So the cost function for the K-Means algorithm is given as:
J=∑ni=1||Xi−μk(i)||2=∑Kk=1∑iϵCk||Xi−μk||2
Now in the next video, we will learn what exactly happens in the assignment step? and we will also look at how to assign each data point to a cluster using the K-Means algorithm assignment step.
[Note: At 1:43 where the Prof explains the optimization step, the values in the column – μ1 and μ2 should be X1 and X2 ]
In the assignment step, we assign every data point to K clusters. The algorithm goes through each of the data points and depending on which cluster is closer, in our case, whether the green cluster centroid or the blue cluster centroid; It assigns the data points to one of the 2 cluster centroids.
The equation for the assignment step is as follows:
Zi=argmin||Xi−μk||2
Now having assigned each data point to a cluster, now we need to recompute the cluster centroids. In the next lecture, Prof.Dinesh will explain how to recompute the cluster centroids or the mean of each cluster.
In the optimization step, the algorithm calculates the average of all the points in a cluster and moves the centroid to that average location.
The equation for optimization is as follows:
μk=1nk∑i:zi=kXi
The process of assignment and optimization is repeated until there is no change in the clusters or possibly until the algorithm converges.
[Note – The definition of Silhouette score contains an error in the link shared above]
In the next segment, we will learn how to look K-Means algorithm as a coordinate descent problem. We will also learn about the constraint of the K-Means cost function and how to achieve global minima.
K Means++ Algorithm
We looked in the previous segment that for K-Means optimisation problem, the algorithm iterates between two steps and tries to minimise the objective function given as,
Zi=argmin||Xi−μk||2
To choose the cluster centres smartly, we will learn about K-Mean++ algorithm. K-means++ is just an initialisation procedure for K-means. In K-means++ you pick the initial centroids using an algorithm that tries to initialise centroids that are far apart from each other.
To summarise, In K-Means++ algorithm,
- We choose one centre as one of the data points at random.
- For each data point Xi, We compute the distance between Xi and the nearest centre that had already been chosen.
- Now, we choose the next cluster centre using the weighted probability distribution where a point X is chosen with probability proportional to d(X)2 .
- Repeat Steps 2 and 3 until K centres have been chosen.
Visualising the K Means Algorithm
Let’s see the K-Means algorithm in action using a visualization tool. This tool can be found on naftaliharris.com. You can go to this link after watching the video below and play around with the different options available to get an intuitive feel of the K-Means algorithm.
Suppose you have implemented k-means and to check that it is running correctly, you plot the cost function J(c^{(1)}, \dots, c^{(m)}, \mu_1, \dots, \mu_k)J(c(1),…,c(m),μ1,…,μk) as a function of the number of iterations. Your plot looks like this:

What does this mean?
The learning rate is too large.
The algorithm is working correctly.
The algorithm is working, but kk is too large.
It is not possible for the cost function to sometimes increase. There must be a bug in the code.